

Discover more from The Held Report
Background
History doesn’t repeat itself, it rhymes.
Previous Bitcoin market cycles have some commonality between them: reduction in supply via halving, no material change in how humans feel FOMO and fear, and the macro backdrop reinforces the reason why we need Bitcoin (we’re not going back to the gold standard or trying to fix the budget deficit).
During each bull run, Bitcoin has to overcome a series of mental thresholds, whether that be new or existing FUD, price levels (breaking through previous all-time high), or structural (exchange infrastructure in 2013 and 2017 had major issues.
The Price of Bitcoin
“A viral loop is a mechanism that drives continuous referrals for continuous growth.
It’s how you drive your existing customers to refer others to your brand, and in turn, get those new customers to tell even more people about you. This creates a lasting loop which can potentially lead to exponential viral growth.” - Referral Rock
Most of us heard about Bitcoin in 2013, 2017, when friends and family were talking about the rapid price increase. It’s through this viral loop that Bitcoin grows in adoption. The price is that signal to folks that Bitcoin is interesting, solves a problem for them, and that others are recognizing it as new money. If Bitcoin’s price had stayed at $100, $1,000, etc. none of us would be here. While there is volatility, we keep seeing higher lows that create a long term trend upwards.
Satoshi built a viral loop into Bitcoin.
“As the number of users grows, the value per coin increases. It has the potential for a positive feedback loop; as users increase, the value goes up, which could attract more users to take advantage of the increasing value.” - Satoshi Nakamoto
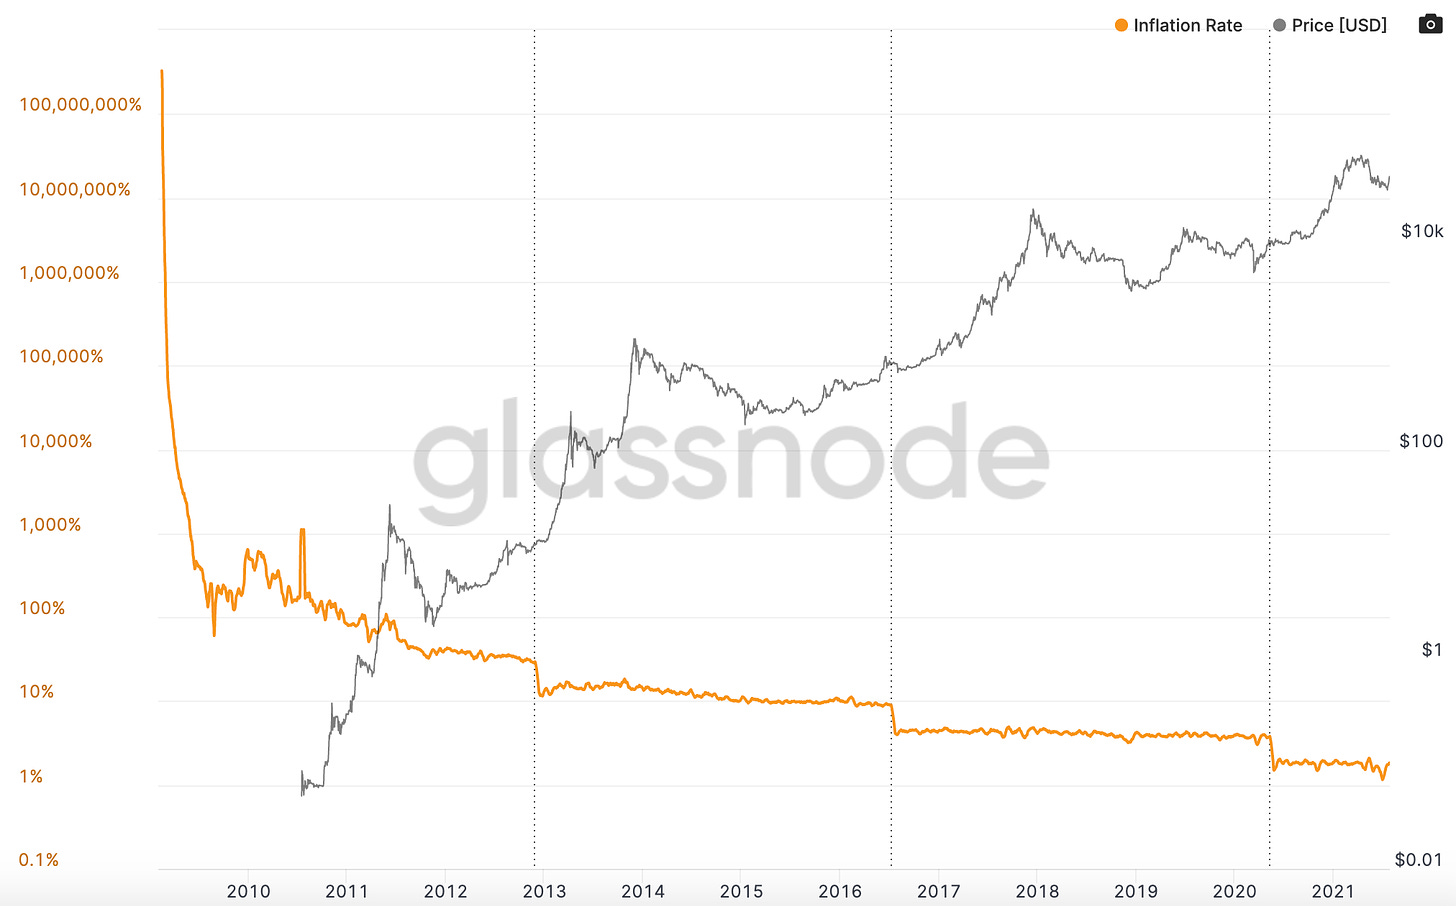
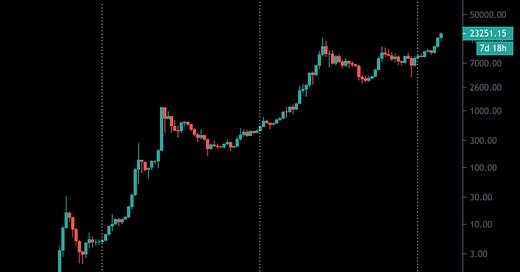
Satoshi wrote this before Bitcoin was even worth $0.01. In the chart below, we have Bitcoin’s price, inflation rate (aka issuance of new coins), and halvings which are the dotted lines. As we can see, a bull run has occurred after each halving.
This price viral loop is the most key component of how Bitcoin grows.
In a previous newsletter titled “The Price of Bitcoin” I dive in deep as to how Bitcoin’s price is the singular function that enables Bitcoin to grow in user adoption, liquidity, funding, security, and core development.
2013 Bitcoin Cycle
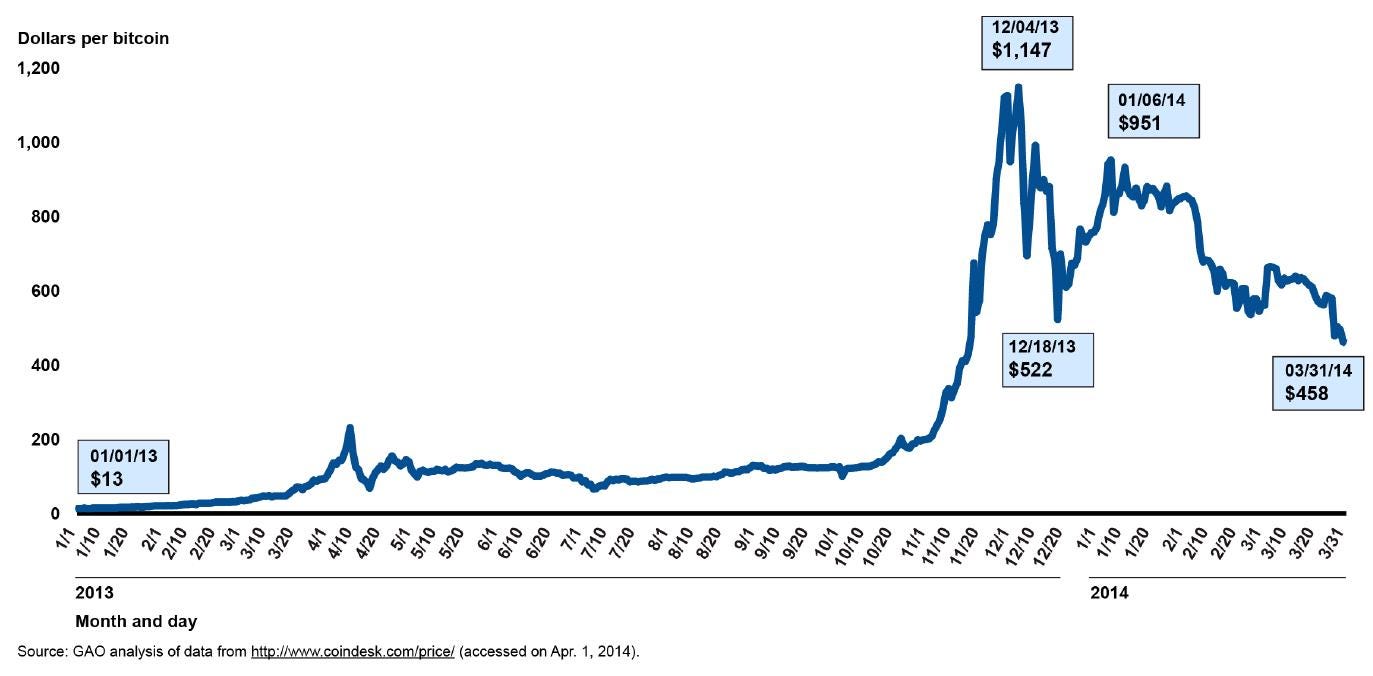
This was the bull run that put Bitcoin on the map. Bitcoin went from obscurity to mainstream visibility for the first time. It started the year at $13, had a spike to $260, then retraced to ~$80 for nearly 6 months until the winter, when it surged again to ~$1,200.
What most OGs remember from that time was a feeling of impending doom that we might be arrested for what we were doing. Our purpose was to create new money that directly undermined the authority of the state!
Back then there were nearly no regulations, no arrests, no content, no easy-to-use products, etc. It was truly the wild west, and was insanely risky for a newbie. For example:
Operational:
Coinbase sourced Bitcoin from Bitstamp. They were a brokerage at the time not an exchange. They only had $1M worth of volume in all of February 2013 (right before the bull run).
In April, payment processors BitInstant and MtGox experienced processing delays due to insufficient capacity resulting in the bitcoin exchange rate dropping from $266 to $76 before returning to $160 within six hours.
Two companies, Robocoin and Bitcoiniacs launched the world's first bitcoin ATM on 29 October 2013 in Canada, allowing clients to sell or purchase bitcoin currency at a downtown coffee shop. Chinese internet giant Baidu had allowed clients of website security services to pay with Bitcoin. This was the first wave of companies that would accept Bitcoin as payment.
Regulatory:
Silk road (drugs) and Satoshi Dice (gambling) represented a large portion of use cases.
In May, the US authorities seized accounts associated with Mt. Gox after discovering that it had not registered as a money transmitter with FinCEN in the US. Regulators were finally starting to establish some guidelines around what was legal and which agency had jurisdiction.
In October, the FBI seized roughly 26,000 BTC from Silk Road and arrested the alleged owner Ross William Ulbricht.
On 5 December 2013, the People's Bank of China prohibited Chinese financial institutions from using bitcoins. (China FUD never dies) After the announcement, the value of bitcoins dropped, and Baidu no longer accepted bitcoins for certain services.
Protocol
In March, the Bitcoin blockchain temporarily split into two independent chains with differing rules on how transactions were accepted. For six hours two Bitcoin networks operated at the same time, each with its own version of the transaction history. The core developers called for a temporary halt to transactions, sparking a sharp sell-off. Mt. Gox briefly halted Bitcoin deposits and the exchange rate briefly dipped by 23% to $37 as the event occurred before recovering to its previous level of approximately $48 in the following hours.
2013 was crazy. A tiny niche weird group of people all of a sudden were thrust into the spotlight, regulators were scrambling to figure it out, and the market infrastructure was just getting in place.
I still remember the Bitcoin meetup in January 2013 just being a few folks gathered together at a former crackhouse (20Mission) who all wanted to talk about Bitcoin. The picture below is the one from the February event.
We even had a party when it hit $100! To think that it would become something this large was unfathomable.
Zooming out, this was just the beginning. There was another 2017 bull run, and now we’re in the middle of the next one: 2021.
2021
This era is far different.
There are 100M Bitcoin HODLers
There is a massive trading infrastructure in place.
There is a relatively certain regulatory structure.
Institutions: banks, corporations, nation-states, hedge funds, sovereign wealth funds, and insurance companies all now hold Bitcoin.
Even some politicians are outspoken about how they think Bitcoin is a good thing for society.
So how does 2021 play out price wise?
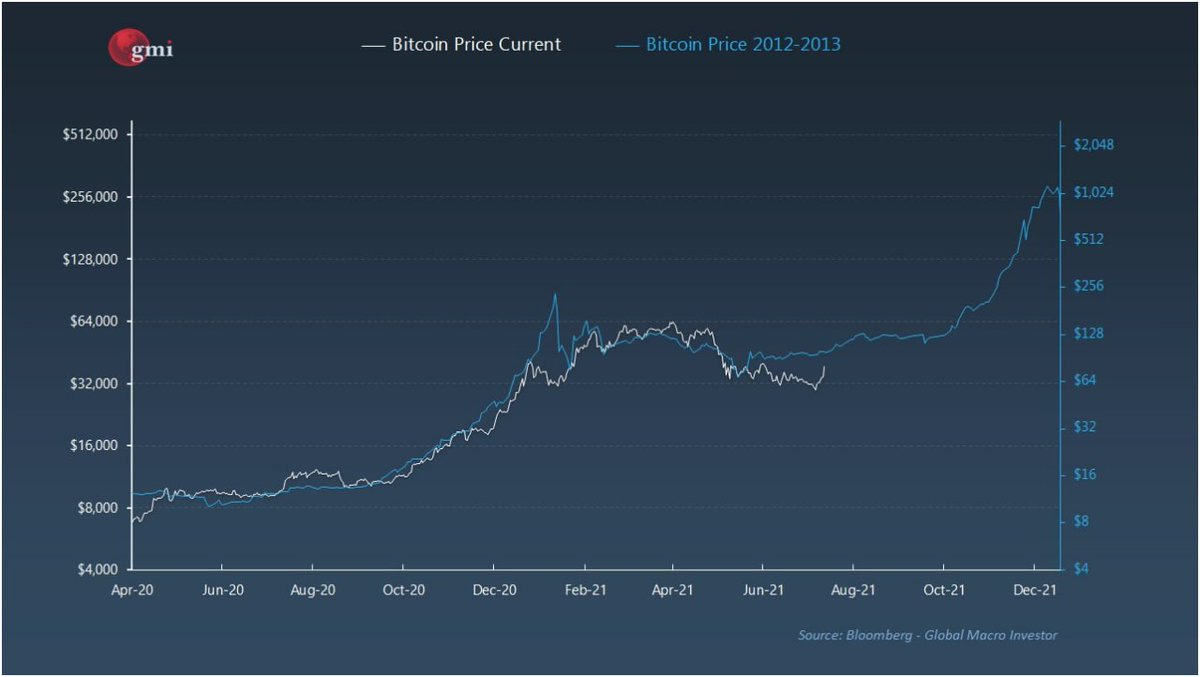
So far we’ve gone from ~$8k right before the bull run to $64k, back down to low $30’s.
But what does this look like if we overlay it on the 2013 bull run? As you can see, it is eerily similar with an intense first bull run, then an extended pullback, with one last bull run at the end.
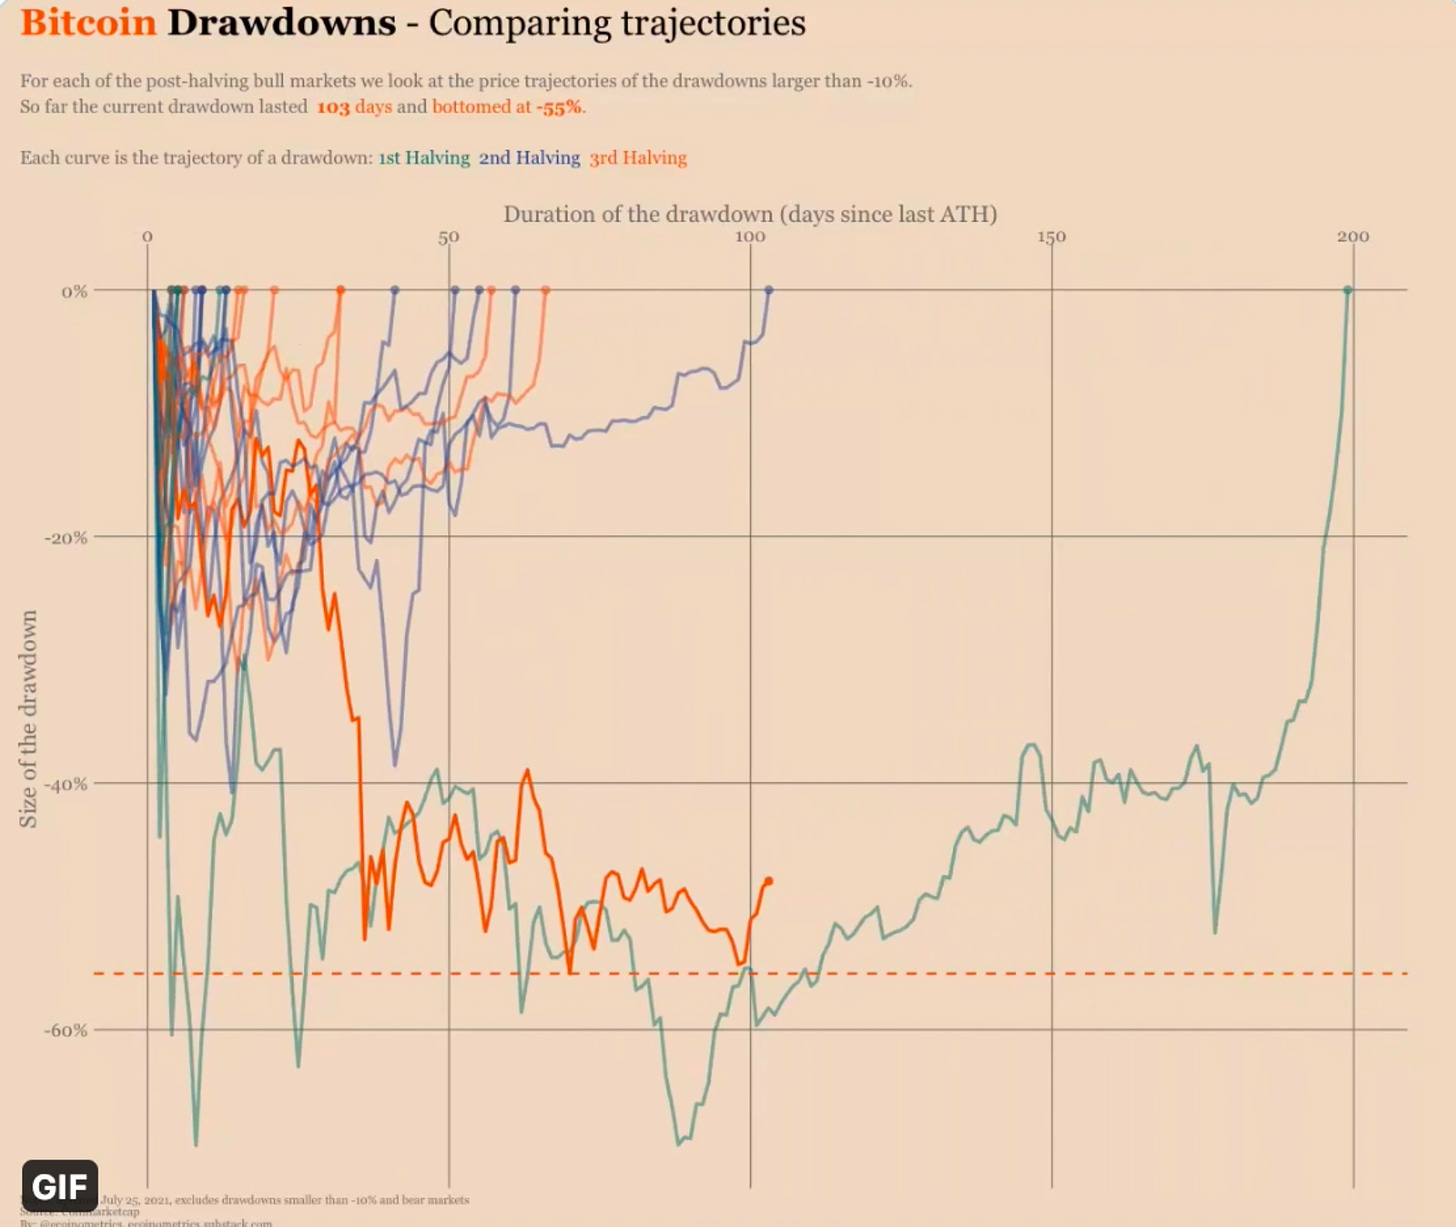
Now where is this drawdown/recovery versus all previous bull market drawdowns? Econometrics, a phenomenal analyst in the space, visualized this via a GIF. I took a screenshot of the final frame:
As you can see, this cycle is looking very similar to 2013.
If history rhymes, we should have sideways chop a little longer, then an insane winter.
HODL,
Dan







and even if it doesn't.. it wouldn't change my opinion on the matter. +1
👏